
How wholesale electricity markets set your business electricity bill and what this means in the era of surging data center electricity demand. Capacity, transmission, and energy explained, plus the levers that actually cut costs.
Key Overview:
> Why Costs Are Rising: PJM’s capacity price went from roughly $29/MW-day to $270/MW-day in a single auction — an increase north of 800%. Then it cleared at the regulatory ceiling three consecutive times: $329.17/MW-day for 2026/2027, $333.44/MW-day for 2027/2028, and $325/MW-day for 2028/2029.
> Without the price collar, PJM estimates the 2028/2029 auction would have cleared at $554.72/MW-day, taking total cost from $16.4 billion to nearly $30 billion. The suppressed number is the real signal.
> Thesis: You cannot negotiate a cost you don’t understand. Most businesses shop for a price. The businesses that win manage a cost structure. Scope note: We use PJM because it’s our home market (Philadelphia, Mid-Atlantic). ERCOT, NYISO, ISO-NE, and MISO differ in the details but the architecture is the same: a wholesale market with energy, ancillary, and capacity products; a regulated wires business; and a competitive retail layer on top.
> How to use this guide: Parts 1–5 build the wholesale picture. Part 6–7 translate it to your bill.
Table of Contents (click to skip ahead):
- Part 1 – The Anatomy of the Grid
- Part 2 – What Grid Operators Actually Do
- Part 3 – Generators
- Part 4 – Capacity Auctions
- Part 5 – Transmission
- Part 6 – Retail Electric Suppliers
- Part 7 – Impacts on Your Commercial Electric Bill
Introduction: The Cost Nobody Decided To Increase
Somewhere in your general ledger there’s a line for electricity. For most of the past two decades, it behaved itself. It moved a few percent a year, it tracked roughly with the weather, and nobody in your organization was asked to explain it.
That line has changed character. Not because you’re using more power, and not because anyone at your company made a decision. It changed because the wholesale market underneath it repriced — dramatically, in a compressed window, for reasons that have almost nothing to do with your business.
Here’s what that looks like in practice.
Where your money actually goes
Take a mid-sized Eastern Pennsylvania facility: roughly 5,000 MWh per year, about 1 MW of peak demand, steady two-shift operation. A representative decomposition of the supply side of that bill looks something like this:
| Component | ~$/MWh | Share |
|---|---|---|
| Energy (the actual electricity, delivered to your zone) | $52 | 53% |
| Capacity (a reliability payment — not electricity at all) | $24 | 24% |
| Transmission (network service on the high-voltage grid) | $12 | 12% |
| Ancillary services and renewable compliance | $6 | 6% |
| Supplier risk premium and margin | $5 | 5% |
| Total | ~$99/MWh |
Illustrative only. Actual figures vary substantially by utility zone, load shape, contract structure, and delivery year.
Now look at what that table is telling you.
The thing you shopped for — energy, the commodity, the number your supplier quoted you and the number you compared across three proposals — is roughly half of your supply cost. The second-largest line, capacity, isn’t electricity. It’s an availability payment to power plants for existing, whether or not they generate a single kilowatt-hour for you. You didn’t negotiate it. It was set by an auction you’ve likely never heard of, and your share of it was determined by how much power your facility happened to be drawing during five specific hours last summer.
For a facility like the one above, that capacity line runs near $119,000 a year. Five hours of operational awareness last July would have moved it meaningfully. Nobody was watching.
This guide is about the other half of your bill — the half that isn’t a commodity, isn’t quoted, and until recently didn’t matter enough to learn.
What happened in the market
The reason capacity moved from a footnote to a headline is straightforward, and the numbers are stark.
After clearing below $35/MW-day in PJM’s 2023/2024 and 2024/2025 capacity auctions, prices jumped dramatically beginning with the 2025/2026 auction and have remained elevated ever since. That 2025/2026 auction produced a price increase of more than 800% — a single auction cycle that reset the cost basis for 67 million people’s electricity.
It did not come back down. The three auctions since have each cleared at the regulatory ceiling: $329.17/MW-day for the 2026/2027 delivery year, $333.44/MW-day for 2027/2028, and $325/MW-day for 2028/2029.
That word — ceiling — is the part most coverage glosses over, and it’s the part you need to understand. Those prices didn’t clear at market equilibrium. They clered at a cap, negotiated between the governors of the thirteen PJM states and federal regulators, specifically to hold costs down. Without that cap, PJM estimates the most recent auction would have cleared at $554.72/MW-day, taking the total from $16.4 billion to nearly $30 billion.
A price cap suppresses a number. It does not create a power plant. And the underlying shortage is real: in that same auction, PJM procured capacity leaving a 14.7% reserve margin — 6,831 MW, or 5.6%, below its own reliability requirement.
PJM’s own diagnosis is worth stating plainly. The grid operator describes a “transition gap,” in which accelerated demand has collided with rigid physical and administrative constraints on supply — a load forecast that tripled historical growth rates on the back of data center proliferation, chasing a target that expands faster than infrastructure can physically be built.
Data centers didn’t cause your electricity costs to rise out of malice or mismanagement. They arrived faster than generation and transmission could be built, in a market designed around the assumption of flat demand. Everyone connected to that market now shares the repricing. That includes you.
The premise of this guide
Most businesses respond to a rising electricity cost by shopping harder. They collect more quotes, squeeze the supplier, and pick the lowest number.
That approach optimizes half of one line in the table above.
The businesses that actually reduce their electricity spend do something different. They decompose the cost into its components, identify which components respond to procurement and which respond to operations, and then manage each on its own terms. Some of the largest available savings have nothing to do with the price you negotiate — they come from changing what your meter reads during a handful of hours, or from correcting a rate class, or from timing a renewal against a forward curve instead of against a contract expiration date.
You cannot do any of that without understanding how the money moves. So that’s what this guide covers: the full path from a generator’s offer into PJM’s dispatch stack, through the capacity and transmission markets, into a retail supplier’s cost stack, and onto the line item you’re looking at.
It’s technical. That’s deliberate. Everything worth knowing here has been kept slightly opaque, and the opacity is not accidental — it favors the party with better information, which has not historically been you.
How to use this guide
- Parts 1–5 build the wholesale picture: who does what, how PJM dispatches and prices power, what generators actually sell, how capacity auctions work, and why transmission costs are climbing.
- Parts 6–7 translate all of that into a retail contract and a bill you can read line by line.
If you only have twenty minutes, read Part 7 (reading your bill). If you have a renewal inside the next eighteen months, contact us today.
A note on scope
We use PJM throughout because it’s our home market. Puleo Energy is based outside Philadelphia and we’ve worked in this footprint for fourteen years, so the examples, price data, and program details here are PJM-specific.
PJM operates the high-voltage grid serving 67 million people across all or parts of thirteen states and the District of Columbia — Delaware, Illinois, Indiana, Kentucky, Maryland, Michigan, New Jersey, North Carolina, Ohio, Pennsylvania, Tennessee, Virginia, and West Virginia.
If you operate in ERCOT, NYISO, ISO-NE, MISO, or CAISO, the specific auction names and dollar figures will differ, and in ERCOT’s case the capacity construct doesn’t exist at all. But the architecture is the same everywhere: a wholesale market that prices energy, reliability, and grid services separately; a regulated wires business you cannot shop; and a competitive retail layer that bundles all of it into the number on your invoice. Learn the structure once and it travels.
Let’s start with who’s actually in the room.
Part 1 — The Anatomy of the Grid: Who Does What
Most business owners believe they have one electricity relationship. They have six, and only one of them is negotiable.
Sorting out who’s who isn’t trivia. Every dollar on your invoice is set by a different party, under a different set of rules, answerable to a different regulator. Some of those dollars are competitive. Some are formula-driven and untouchable. Knowing which is which determines where you spend your attention.
1.1 What restructuring actually did
For most of the twentieth century, your electricity came from a single vertically integrated utility. One company built the power plants, strung the transmission lines, ran the local distribution wires, read your meter, and sent you one bill at a rate approved by your state utility commission. Simple, stable, and entirely without competition.
Starting in the mid-1990s, most of the states in the PJM footprint took that structure apart. The logic was straightforward: building and running power plants is something multiple companies can compete to do. Stringing wires down a street is not. Nobody’s going to build a second set of poles on your block to undercut the first set. Distribution is a natural monopoly; generation isn’t.
So the states split the business in two:
- Generation and supply became competitive. Power plants were spun off or sold to independent producers. Retail suppliers were licensed to sell you electricity. Prices moved to markets.
- Transmission and distribution stayed regulated monopolies. Your local utility still owns the wires, still delivers your power, and still charges rates approved by regulators rather than set by negotiation.
Pennsylvania did this through the 1996 Electricity Generation Customer Choice and Competition Act. New Jersey followed with EDECA in 1999. Maryland, Delaware, Ohio, and D.C. restructured the same year; Illinois in 1997.
The practical result is the sentence to remember from this entire section:
You can change who sells you electricity. You cannot change who delivers it.
That single distinction organizes everything that follows. The supply half of your bill is a market. The delivery half is a regulated tariff. They require completely different strategies, and conflating them is the most common expensive mistake in commercial energy management.
1.2 A caveat: not everyone in PJM can shop
PJM’s territory spans thirteen states, but retail choice was a state-by-state decision, and several states declined.
- Full commercial and industrial retail choice: Pennsylvania, New Jersey, Maryland, Delaware, D.C., Ohio, Illinois.
- Limited or capped choice: Michigan caps competitive supply at a small share of total load, with a waiting list. Virginia permits shopping mainly for very large loads and approved aggregations.
- No retail choice: Kentucky, North Carolina, Tennessee, West Virginia, and Indiana remain traditionally regulated. Your utility is your supplier, full stop.
If you’re in a regulated state, the procurement sections of this guide — structures, futures, renewal timing — describe a market you can’t participate in directly. Capacity tags, transmission peaks, demand charges, rate class optimization, and demand response revenue are functions of how and when you use power, not who sells it to you. Regulated-state customers routinely leave those savings on the table because they’ve been told, accurately but incompletely, that they “can’t shop.”
And if you operate facilities across multiple states, you’re running both playbooks simultaneously — which is its own reason to treat this as a discipline rather than a triennial errand.
1.3 The cast of characters
| Player | What they do | Regulated by | Can you choose them? |
|---|---|---|---|
| Generators (IPPs) | Own and operate power plants; sell energy, capacity, and ancillary services into wholesale markets | FERC | No — but their costs reach you |
| PJM (the RTO) | Dispatches the grid every five minutes, runs the wholesale markets, plans transmission, manages the interconnection queue | FERC | No |
| Transmission Owners | Own and build the high-voltage network; recover costs through FERC formula rates | FERC | No |
| EDCs / Utilities (PECO, PPL, PSE&G, BGE, ComEd, Dominion…) | Own the local poles and wires, deliver power, read meters, usually issue your bill | State PUC | No |
| Retail Suppliers (REPs / ESCOs) | Buy wholesale, package and hedge it, sell you a retail contract | State PUC | Yes |
| Brokers / Advisors | Source, structure, and manage supply on your behalf | State PUC (licensing) | Yes |
| You | Consume power — and, through your usage patterns, determine your own share of several of the costs above | — | — |
Two things worth sitting with in that table.
First, exactly one row is genuinely competitive. Everything else is either a regulated monopoly or a market you participate in only indirectly. That’s a narrow lever, and it explains why businesses that focus solely on supplier shopping hit a ceiling fast.
Second, look at the last row. You are not a passive recipient of these costs. Your capacity charge, your transmission charge, and your demand charge are all allocated to you based on your own metered behavior during specific hours. That’s not a market you shop. It’s a rule set you can play — and it’s where the leverage that survives a bad market actually lives.
1.4 The mental model that makes the rest of this make sense
Here’s the conceptual mistake almost everyone starts with: imagining electricity flowing from a particular power plant, through a particular set of wires, to your particular building — like water through a dedicated pipe.
It doesn’t work that way. The grid is a single shared pool.
Picture a lake. Every generator pours water in. Every customer draws water out. The lake has to stay at exactly the same level at every instant — that’s the physics of grid frequency, and it’s non-negotiable. Nobody’s water is labeled. When you draw from the lake, you get lake water. When your supplier “sells you power,” they are pouring an equivalent volume in somewhere else on your behalf.
Three consequences follow, and each one matters later:
You do not receive specific electrons from a specific plant. Your contract is a financial arrangement, not a physical delivery path. This is not a technicality — it’s the reason a supplier with no generating assets whatsoever can legitimately sell you electricity.
Renewable energy contracts are financial claims. When you buy green power, you’re purchasing Renewable Energy Certificates representing generation that occurred somewhere on the system. The electrons reaching your building are identical either way. This isn’t a knock on renewable procurement — it’s a real market with real effects on what gets built. But understanding what you’re buying prevents both overpaying and overclaiming.
Your bill is a share of a system-wide cost, divided up by rules. Nobody meters “your” capacity or “your” transmission usage in any physical sense. PJM incurs enormous costs to keep the lake full and the banks intact, and then allocates those costs across everyone drawing from it according to published formulas.
That last point is the thesis of this entire guide. The allocation formulas are where the money is. They’re not secret — they’re in PJM’s tariff and your utility’s rate schedules, thousands of pages of public documents that virtually no customer reads. They reward specific behavior at specific times, and they penalize the absence of it.
Your capacity charge is set by your draw during five hours. Your transmission charge is set by your draw during one hour. Your demand charge is set by your worst fifteen-minute interval in a month. None of that is negotiated. All of it is manageable — but only by someone who knows the rules exist.
So that’s where we go next: to the entity that writes and administers those rules, dispatches the entire pool every five minutes, and sets the price of power for 67 million people.
Part 2 — Grid Operators: What PJM Actually Does
There is an organization in Valley Forge, Pennsylvania that sets the price of electricity for 67 million people, owns not a single power plant or power line, and earns no profit from any of it.
Understanding PJM matters for a practical reason: it is the source of roughly three-quarters of your supply cost. Your retail supplier doesn’t set your energy price, doesn’t set your capacity price, and doesn’t set your transmission price. It buys those things from markets PJM administers, marks them up, and sells you the bundle. Everything upstream of your supplier’s margin is decided here.
2.1 What an RTO is
PJM is a Regional Transmission Organization — an independent, not-for-profit entity that operates the high-voltage grid across all or parts of thirteen states and the District of Columbia, serving more than 67 million people. Founded in 1927 as the world’s first power pool, it became an independent system operator in 1997 and a full RTO under FERC in 2002. PJM
It does five things:
- Reliability coordination. Keeping supply and demand balanced instant to instant, and keeping the system within its physical limits.
- Economic dispatch. Deciding which generators run, in what order, every five minutes.
- Market administration. Running the energy, capacity, and ancillary services markets, and settling the money.
- Transmission planning. The Regional Transmission Expansion Plan (RTEP), which determines what gets built — and, as we’ll see in Part 5, what you pay for.
- Interconnection. Processing the queue of generators and large loads that want to connect.
Three structural facts shape how PJM behaves, and they’re worth knowing before you form an opinion about your bill:
It owns nothing. No generation, no transmission lines. PJM is an air traffic controller and a stock exchange, not an airline. When your bill goes up, PJM didn’t capture that money.
It has no profit motive. PJM recovers its operating costs through an administrative fee that shows up on your bill as a fraction of a dollar per MWh — genuinely the smallest line in the stack.
It answers to FERC and to its own members. Rules change through a stakeholder process — committees where generators, utilities, suppliers, states, and consumer advocates fight things out — and then get filed with the Federal Energy Regulatory Commission for approval. There is also an Independent Market Monitor (Monitoring Analytics) with a statutory mandate to watch for market power abuse and publish critiques, including of PJM itself.
That governance structure is slow and contentious, and it’s why market reforms take years while load growth takes months. Hold that thought — it’s the whole story of Part 4.
2.2 Economic dispatch: how the price gets made
Here’s the mechanism that determines the largest line on your bill.
Every five minutes, PJM takes the offers from every available generator on the system and stacks them from cheapest to most expensive. It then dispatches up that stack — turning on the cheapest units first — until supply exactly meets demand.
The last unit dispatched sets the price for everyone.
Not the average. Not what each unit bid. Every generator dispatched in that interval receives the offer price of the marginal unit — the final one needed to serve the last increment of load.
This is called uniform clearing price or marginal pricing, and it’s the single most important concept in wholesale power. It’s also the one that reliably makes business owners angry when they first encounter it, because it means a nuclear plant with near-zero fuel cost gets paid the same price as the expensive gas turbine that happened to be last in line.
The economic rationale: paying everyone the marginal price gives generators exactly the right incentive. Bid your true cost, because bidding higher risks not clearing, and bidding lower risks running at a loss. It also sends an honest signal about scarcity — when prices are high, the market is telling you the system is tight and new supply is worth building. Critics counter that in a market with a persistently high-cost marginal fuel, inframarginal generators collect substantial rents at consumers’ expense. It’s a live policy debate across every restructured market in the country. What isn’t debated is the mechanism itself, and the mechanism is what prices your power.
The practical upshot for you: in PJM, natural gas is on the margin the overwhelming majority of hours. Nuclear, hydro, wind, and solar bid at or near zero because their fuel is free — they run whenever they’re available. Coal and gas fill in above them. So the unit setting your price is usually a gas plant, which means:
Power price ≈ natural gas price × the heat rate of the marginal unit
Watch natural gas and you are, most of the time, watching electricity.
The “security-constrained” part. PJM’s dispatch isn’t purely economic — it’s security-constrained economic dispatch. The cheapest available generator can only be dispatched if the transmission system can physically deliver its output to where the demand is. Wires have thermal limits. When a line hits its limit, PJM must dispatch a more expensive unit on the correct side of that constraint.
That single caveat creates congestion, and congestion creates the geography of electricity pricing.
2.3 Locational Marginal Pricing: why your zip code has a price
Because the grid is physically constrained, electricity does not have one price. It has thousands.
LMP = System Energy Price + Congestion + Marginal Losses
- System energy is the base price — what the marginal unit costs, systemwide.
- Congestion is the adder or subtractor reflecting transmission bottlenecks. If cheap power is trapped behind a constrained line, prices on the far side rise. Think of a highway at rush hour: the fastest route exists, but you can’t get on it, so you take the expensive detour.
- Marginal losses account for the energy physically lost as heat in transmission — roughly 2–5% depending on distance and loading. It’s friction, and it’s priced.
The geography of pricing works in three tiers, and you should know all three because they appear in your contract:
| Tier | What it is | Why you care |
|---|---|---|
| Nodes | ~10,000+ individual pricing points, each a physical location on the network | Where price is actually calculated |
| Zones | Aggregations of nodes, roughly matching utility service territories — PECO, PPL, PSEG, BGE, ComEd, DOM, ATSI | Your load settles at a zonal price |
| Hubs | Trading aggregations, most importantly PJM Western Hub | Where the liquid futures market trades |
And now the term that quietly costs businesses real money:
Basis is the price difference between the hub where your supplier hedges and the zone where your load actually settles.
Your supplier buys energy at Western Hub, because that’s where liquidity is. Your facility consumes in PECO or PSEG or ComEd. The spread between those two prices is basis, and your supplier either hedges it or prices in the risk of not hedging it. Either way, you pay for it.
Basis is real money — it can run several dollars per MWh, and in constrained zones considerably more. It’s also almost never discussed in a retail sales conversation. When you’re comparing two quotes, asking how each supplier handled basis will tell you a great deal about which one actually knows what it’s doing.
Where congestion revenue goes. The money collected through congestion doesn’t vanish. It funds Financial Transmission Rights — instruments that let market participants hedge congestion — and the associated Auction Revenue Rights, which are allocated to load-serving entities. You’ll likely never trade an FTR. But if a supplier’s contract mentions congestion hedging or FTR cost allocation, that’s what it’s referring to.
2.4 Two markets, two settlements
PJM runs energy pricing twice, and the distinction has direct consequences for anyone considering an index product.
The Day-Ahead Market is a financial auction cleared once daily for each hour of the following day. Generators submit offers, load-serving entities submit bids, PJM clears the whole thing late morning and publishes hourly prices for all 24 hours of tomorrow. This market is financially binding. Whatever position clears is settled at the day-ahead price regardless of what physically happens. The large majority of energy settles here.
The Real-Time Market is the physical balancing market, dispatched and priced every five minutes. It settles only the difference between what was scheduled day-ahead and what actually occurred — the deviations caused by weather, forced outages, and forecast error.
This is the two-settlement system, and it exists so that participants can lock in a known price in advance while the grid still has a live market to handle reality.
Why this matters to you directly: real-time prices are far more volatile than day-ahead. During a January cold snap or a July heat event, real-time LMP can spike to hundreds or thousands of dollars per MWh for a few intervals. Day-ahead absorbs that risk in advance; real-time delivers it raw.
So if you are ever offered an index product, the first question is which index. A day-ahead-settled index and a real-time-settled index are different products with materially different risk profiles, and the difference will not be obvious from the headline adder.
2.5 The context that explains everything after this
One number frames the rest of this guide. During summer 2025, PJM’s highest coincident peak demand reached 160,153 MW, set on June 23 in the hour ending at 6:00 p.m.
Note the shape of that: a single hour, on a hot June weekday, at the end of the workday. PJM must build and maintain a system capable of serving that hour — and it must do so with reserve margin on top, for reliability.
That’s an enormous amount of infrastructure sized for a handful of hours a year. And it explains the entire architecture that follows. The energy market pays for electricity. The capacity market pays for the ability to serve that one hour. Two separate products, two separate lines on your bill, two entirely separate strategies for managing them.
Which brings us to what generators are actually selling.
Part 3 — Generators: The Three Products They Sell
A power plant looks like one business. Financially, it’s three.
It sells electricity, measured in megawatt-hours. It sells grid services — the ability to adjust output on command, in seconds. And it sells availability, which is a promise to exist and be ready on the worst day of the year, whether or not it generates anything at all.
Three products, three revenue streams, three separate markets. And — this is the part that matters to you — three separate lines on your bill. The structure of your invoice isn’t an accounting quirk. It’s a direct reflection of what generators are selling.
3.1 Product One: Energy
What it is: payment for actual electricity delivered, priced in dollars per megawatt-hour.
Part 2 covered how the price gets set — stack the offers cheapest to most expensive, dispatch up the stack, the marginal unit sets the price for everyone. Here’s what that stack actually looks like in PJM, and what it means for what you pay.
The dispatch stack, bottom to top:
| Tier | Resources | Marginal cost | Behavior |
|---|---|---|---|
| Bottom | Nuclear, wind, solar, run-of-river hydro | Near zero | Run whenever available |
| Middle | Coal, combined-cycle gas | Moderate | Cycle with demand |
| Top | Combustion turbines, oil, diesel | High | Run only when needed |
Resources at the bottom bid at or near zero because their fuel is free or their economics punish shutting down. They aren’t setting the price; they’re taking it. Resources at the top exist almost entirely for the top few hundred hours of the year.
For scale on what’s out there: the resource mix that cleared PJM’s 2026/2027 capacity auction was 45% natural gas, 21% nuclear, 22% coal, 4% hydro, 3% wind, and 1% solar.
Heat rate: the number that connects gas to power.
A thermal generator’s efficiency is measured as heat rate — the British thermal units of fuel required to produce one kilowatt-hour of electricity. Lower is better.
- Modern combined-cycle gas plant: roughly 6,500–7,000 Btu/kWh
- Older simple-cycle combustion turbine: roughly 10,000–11,500 Btu/kWh
Multiply heat rate by the delivered gas price and you have that unit’s fuel cost per MWh. At $3.50/MMBtu gas, a 7,000 Btu/kWh combined-cycle unit burns about $24.50 of gas per MWh. An 11,000 Btu/kWh peaker burns about $38.50 for the same output.
That spread is the entire logic of the dispatch stack — and it’s why the marginal unit’s identity matters as much as the gas price. When demand is moderate and efficient combined-cycle units are on the margin, power prices track gas closely. When demand climbs and peakers set the price, the same gas price produces a much higher power price.
Run the calculation backward and you get the diagnostic that professional buyers actually watch:
Market Implied Heat Rate = Power Price ÷ Gas Price
If power prices rose but the implied heat rate held steady, gas moved and power followed. If the implied heat rate rose, something else happened — scarcity, congestion, a tighter supply stack. Same headline increase, entirely different causes, entirely different implications for whether you should lock a price today.
What energy revenue looks like to a generator: volatile, weather-driven, and — critically — concentrated. A merchant plant earns most of its annual energy margin in a small number of high-priced hours. Which sets up the problem in 3.3.
3.2 Product Two: Ancillary Services
What they are: the services that keep the grid stable, as opposed to merely supplied.
Energy keeps the lights on. Ancillary services keep them steady. These are the shock absorbers, and they exist because electricity has an unforgiving physical requirement: supply and demand must match continuously, not on average. The grid runs at 60 hertz, and it must stay there. Drift far enough in either direction and equipment trips offline — first generators, then, in a cascade, the system itself.
Balancing that in real time requires resources standing by to move on command. PJM procures several distinct products:
Regulation (Reg-A and Reg-D). Second-by-second correction of the tiny, constant mismatches between supply and demand. PJM sends automated signals every few seconds; resources adjust output to follow. Reg-A serves slower, sustained corrections; Reg-D handles fast, energy-neutral swings. Batteries dominate Reg-D — a lithium-ion system can go from full charge to full discharge in under a second, which no thermal plant can approach.
Synchronized Reserve. Generation already spinning and connected to the grid, able to increase output within ten minutes. Because the machine is already turning, response is nearly immediate.
Non-Synchronized Reserve. Resources that can start from standstill and deliver within ten minutes — fast-start combustion turbines, mainly. Together with synchronized reserve, this forms Primary Reserve.
30-Minute (Secondary) Reserve. The next tier out, replenishing the faster products once they’ve been deployed.
Reactive Supply and Voltage Control. Managing voltage rather than frequency. Necessary, invisible, and generally cost-allocated rather than market-cleared.
Black Start. The small set of units capable of starting without any external power source, used to restart a collapsed grid. Contracted rather than auctioned, and worth exactly what it sounds like it’s worth.
Cost magnitude and direction. Historically, ancillary services were a rounding error on your bill — a couple of dollars per MWh, sometimes less. Two things are changing that.
First, PJM’s 2022 reserve market reforms raised reserve procurement and pricing, increasing the total dollars flowing through these products. Second, and more structurally: as inverter-based resources displace large spinning generators, the system loses rotational inertia — the physical flywheel effect of thousands of tons of steel spinning in synchrony, which has historically absorbed disturbances for free. Less inertia means more purchased balancing services. Meanwhile, steeper net-load ramps in the late afternoon require more flexible capability on standby.
Why you should care about a line item this small: because it moved from “included” to “pass-through” in a lot of retail contracts after 2024. A cost you don’t control and don’t watch is exactly the kind that grows quietly. And if you have flexible load or on-site storage, ancillary markets are a place to earn rather than only pay.
3.3 Why Energy and Ancillary Services Aren’t Enough
Here’s the problem that the entire capacity market exists to solve. It’s worth understanding, because the resulting charge is now the second-largest line on your bill.
Consider a peaking plant. It’s a combustion turbine built for one purpose: to run during the hottest afternoons and coldest mornings of the year, when nothing else is left. In a typical year it might operate 50 to 150 hours — somewhere between half a percent and two percent of the time.
The plant costs well over a hundred million dollars to build. It has fixed costs every single day of the year: debt service, insurance, property taxes, staffing, maintenance, interconnection charges. And it earns energy margin during roughly one percent of the hours.
Run the arithmetic and it doesn’t work. To recover its full fixed cost from energy sales alone, that plant would need to capture extraordinary prices during the handful of hours it runs — prices in the thousands of dollars per megawatt-hour.
This is the “missing money” problem, and every restructured electricity market in the world has had to answer it. There are two available answers:
Let prices spike. ERCOT in Texas does this. There is no capacity market; instead, energy prices are permitted to rise to a very high administrative cap during scarcity, and generators recover fixed costs from those extreme hours. It’s theoretically elegant. It also produces enormous price volatility, and it means a bad week can be financially catastrophic for anyone unhedged — as a great many Texas businesses discovered in February 2021.
Pay separately for availability. PJM does this. Energy prices remain relatively contained, and generators receive a separate payment for being available on the days the system needs them. That payment is the capacity market.
Neither approach is free. The question is only whether you pay through spiky energy prices or a steady availability charge. PJM chose the steady charge. That charge is on your bill, and for the past three years it has been going up fast.
3.4 Product Three: Capacity
What it is: a payment for a resource to be available during periods of system stress, priced in dollars per megawatt-day. It is not a purchase of electricity. Nothing has to be generated for the payment to be earned.
The clearest analogy is an insurance premium — or better, a retainer. You pay a firm to be on call, whether or not you use them, because you need them available on the day you do. That’s what the capacity market buys on your behalf: a fleet standing by for the roughly 160,000 MW peak hour we saw at the end of Part 2.
How much capacity does a resource actually have? Not what’s on the nameplate. This distinction is where most readers get lost, so take it in three steps:
| Term | Meaning |
|---|---|
| ICAP — Installed Capacity | The maximum output of a resource. The nameplate number. |
| UCAP — Unforced Capacity | A resource’s maximum output adjusted for its estimated ability to reliably perform at times of highest system risk. |
| Accredited UCAP | The final figure a resource may actually offer into the auction, after PJM’s accreditation methodology. |
Why the haircut? Because a power plant that’s broken on the hottest day of August has provided zero reliability, whatever its nameplate says. Historically, PJM applied an EFORd adjustment — a forced outage rate derived from each unit’s own history. A 100 MW plant with a 6% forced outage rate offered roughly 94 MW of UCAP.
Marginal ELCC accreditation goes further, and it’s the change that reshaped the auction. Effective Load Carrying Capability asks a different question: not “how often does this unit break,” but “how much additional load can the system reliably serve because this resource exists?”
That question produces very different answers by technology. A solar array generates nothing at 8:00 p.m. during a January cold snap. A four-hour battery is enormously valuable for a short evening peak and useless in a multi-day event. A gas plant with firm fuel supply is worth roughly its nameplate; the same plant relying on interruptible pipeline delivery in winter is worth considerably less.
There’s a second-order effect worth grasping: ELCC is calculated at the margin, so a resource’s accreditation declines as more of that resource type is added. The first gigawatt of solar on a system carries real reliability value. The tenth gigawatt carries much less, because it produces during hours already well covered. Two identical solar farms can be accredited very differently depending on when they entered the market.
The practical consequence: the gap between ICAP and UCAP across the PJM fleet is large and growing. For the 2027/2028 delivery year, roughly 201,000 MW of ICAP was eligible to be offered into the auction or used in an FRR plan — against about 134,500 MW of UCAP that actually cleared. Nameplate megawatts and reliability megawatts are not the same thing, and the difference is why “we have plenty of power plants” and “we’re short on capacity” can both be true simultaneously.
Capacity Performance: the obligation behind the payment.
Taking a capacity payment isn’t passive income. It carries a must-offer obligation — the resource must offer into the energy market when called — and real financial exposure.
PJM declares Performance Assessment Intervals during system emergencies. A resource that underperforms its committed capacity during a PAI pays a non-performance charge. A resource that overperforms receives a bonus, funded by the underperformers.
Winter Storm Elliott in December 2022 is the case study. Extreme cold hit PJM over the pre-Christmas weekend, and tens of gigawatts of generation failed to deliver — frozen equipment, gas supply interruptions, units that simply didn’t start. PJM assessed non-performance charges running into the billions of dollars, and the resulting disputes and settlements ran for years afterward.
The lasting effect on your bill: generators now price performance risk into their capacity offers. A resource weighing a bid must weigh the penalty exposure against the payment. Higher perceived risk means higher offers, and higher offers mean higher clearing prices. Elliott is one of the reasons capacity got expensive and stayed expensive.
3.5 What This Means for Your Bill
Three products, three charges, three completely different management strategies:
| Product | Unit | How your share is determined | How you influence it |
|---|---|---|---|
| Energy | $/MWh | Total kWh consumed | Efficiency, procurement timing, contract structure |
| Ancillary | $/MWh | Allocated with energy | Minimal directly — but you can earn revenue by providing it |
| Capacity | $/MW-day | Your demand during five specific hours last summer | Curtailment during those hours, storage, demand response |
Look hard at that third row. Your capacity charge is not a function of how much electricity you use. It’s a function of when you use it — specifically, your average demand during five hours that PJM identifies after the fact.
Two facilities consuming identical annual kilowatt-hours can pay capacity charges differing by tens of thousands of dollars a year, based entirely on what their meters read on five hot afternoons. One of them knew. The other didn’t.
That’s not a market you shop. It’s a rule you play. And it’s the single highest-return lever available to most commercial and industrial buyers.
But first: how does a market set a price of $325 per megawatt-day, and why has it now hit the ceiling three years running?
Part 4 — Capacity Auctions: How They Work and Why They Broke
Three consecutive PJM capacity auctions have cleared at a regulatory price ceiling.
That sentence should bother you more than a high price would. A market clearing at its cap isn’t a market finding equilibrium — it’s a market being interrupted before it gets there. The price you’re paying is not what capacity is worth. It’s the most you’re currently permitted to be charged for it.
This section explains the machinery that produces that number, why it’s been pinned at the ceiling since 2025, and what happens when the ceiling comes off.
4.1 The mechanism: Reliability Pricing Model
PJM procures capacity through RPM — the Reliability Pricing Model — a forward auction structure introduced in 2007.
The Base Residual Auction (BRA) is the main event. PJM forecasts demand for a future delivery year running June 1 through May 31, calculates how much capacity it needs, and buys it in a single clearing auction. Historically the BRA ran three years forward, giving developers lead time to finance and build.
Incremental Auctions follow — three of them — allowing true-ups as conditions change. Resources that can’t perform buy back their obligations; PJM procures more if the forecast rises. These clear at their own prices, sometimes very different from the BRA. The third Incremental Auction for 2026/2027, for instance, cleared at $164.70/MW-day — below both the collar’s cap and its floor — driven by a 2.5 GW peak load reduction.
One scheduling note that matters for your planning: PJM fell off the three-year cycle during the market reforms of 2023–2025 and has been running a compressed calendar to catch up. The next BRA, for the 2029/2030 delivery year, is scheduled for December 2026, with a return to the normal three-year-forward cycle in May 2027 for the 2030/2031 auction.
Why you care about auction dates: each BRA sets a known capacity cost for a specific twelve-month window. Once an auction clears, that component of your future bill is fixed and public. Align your procurement calendar to it and you’re negotiating with information. Ignore it and you’re signing contracts across a cost discontinuity you could have seen coming.
4.2 The demand side: how PJM decides what to buy
PJM isn’t bidding into this auction as a buyer with a budget. It’s enforcing an engineering standard.
The Reliability Requirement is the target:
Forecast Peak Load × (1 + Installed Reserve Margin) = Reliability Requirement
The Installed Reserve Margin is the cushion above expected peak, and it’s calibrated to a specific standard: one-in-ten Loss of Load Expectation. The system should be expected to require involuntary load shedding no more than once in ten years.
That standard is the reason capacity costs what it does. It isn’t “enough power for a normal August day.” It’s enough for an extreme August day, plus margin for units that fail, plus margin for a forecast that’s wrong.
The VRR Curve. Here’s where the design gets clever, and where most explanations skip.
PJM does not bid a fixed quantity. If it did — a vertical line at exactly the reliability requirement — the price would swing violently. One megawatt short and the price rockets to the cap; one megawatt long and it collapses toward zero. Physical infrastructure markets cannot function on a knife edge like that.
Instead, PJM bids a downward-sloping demand curve: the Variable Resource Requirement. It says, in effect, we’ll pay a great deal for the megawatts we genuinely need, somewhat less for a modest surplus, and progressively less as surplus grows.
The curve is anchored to Net CONE — the Cost of New Entry, net of energy and ancillary margins. Translated: what would it cost to build a new peaker, minus what that peaker could expect to earn selling energy and grid services? The remainder is the capacity payment needed to justify construction.
The non-obvious implication: if energy margins fall, Net CONE rises, and the entire capacity curve shifts up — even if construction costs haven’t moved at all. Capacity prices and energy prices are linked in a way that isn’t visible from either market alone.
The VRR curve also carries administrative caps and floors of its own, separate from the political collar we’ll discuss in 4.6. Keeping those two distinct matters, because commentary routinely conflates them.
4.3 The supply side
Must-offer obligation. Existing capacity resources are generally required to offer into the BRA. Without this, a generator with market power could withhold supply to drive up the price on its remaining fleet.
Market power mitigation. PJM applies the Three Pivotal Supplier test: if the three largest suppliers in a given area are jointly pivotal — meaning the market cannot clear without them — their offers get capped at a formula-derived level rather than accepted as bid. Market power mitigation protocols consistently apply limits to offer prices from existing generation under this test.
This is worth knowing for a specific reason: when someone claims generators are gouging in the capacity market, the TPS test is the structural answer. It doesn’t prove no one profits from scarcity, but the mechanism to restrain offer-side market power exists and is applied every auction.
The FRR alternative. Some utilities and zones opt out of RPM entirely under the Fixed Resource Requirement, self-supplying their own capacity obligation instead. For 2028/2029, FRR entities committed an additional 10,864 MW UCAP on top of what cleared the auction.
FRR matters to you if you’re in an FRR zone, because your capacity cost is set by your utility’s own portfolio rather than the auction clearing price. It’s also why headlines about the clearing price don’t apply uniformly across the footprint.
4.4 Locational clearing: why geography sets your price
You cannot deliver unlimited capacity into a constrained pocket of the grid. If the transmission into eastern New Jersey is maxed out, cheap capacity in Ohio is physically useless there.
So PJM clears the auction locationally, dividing the footprint into Locational Deliverability Areas. For the 2027/2028 auction, PJM modeled MAAC, EMAAC, SWMAAC, PSEG, PS-NORTH, DPL-SOUTH, PEPCO, ATSI, ATSI-Cleveland, ComEd, BGE, PL, DAY, DOM, DEOK, and JCPL as separate LDAs.
When an LDA becomes import-constrained, it clears separately and prices above the parent region. That premium is the Locational Price Adder — and it is pure geography. Same product, same delivery year, different price, because of where your meter is.
Recent auctions have cleared at a uniform RTO price only because the collar compressed everything to the ceiling. Strip the collar away and the locational differences reappear immediately. In PJM’s own simulation of the 2028/2029 auction without the cap, the RTO would have cleared at $554.72/MW-day while the ComEd LDA cleared at $776.69. The prior year’s simulation showed the same pattern: $529.80 RTO-wide with Dominion at $542.83.
Read that carefully. The uniform pricing you’re seeing today is an artifact of the cap. Underneath it, constrained zones — eastern Pennsylvania and New Jersey, the Baltimore–Washington corridor, Northern Virginia, northern Illinois — carry meaningfully higher true costs. When the collar lifts, those differences show up on bills.
4.5 The price history
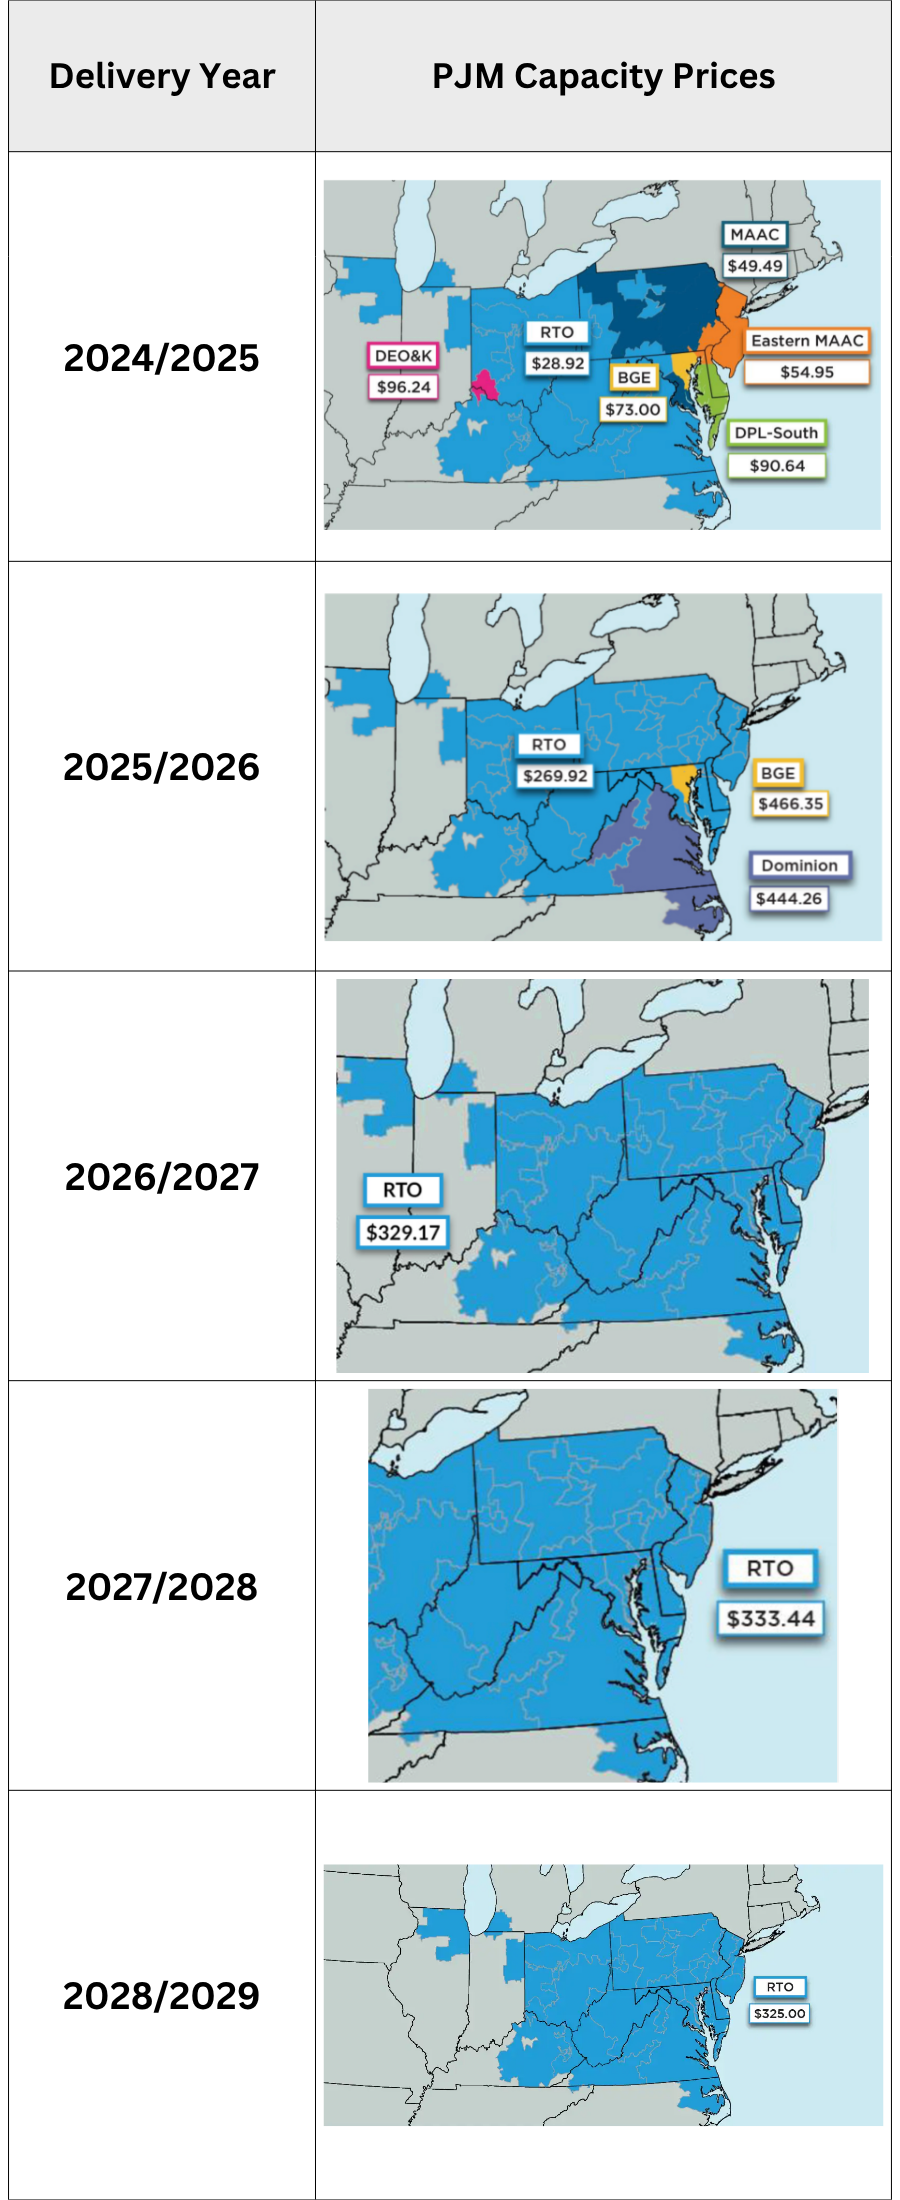
The shape tells the story. Two decades of a capacity market that mostly worked, doing what it was designed to do: signal adequacy, occasionally spike locally, stay modest in aggregate. Then a step change, and a new plateau — one that happens to coincide exactly with a regulatory ceiling.
On that plateau, note the direction of the most recent move. The 2028/2029 result was a 2.5% decrease from 2027/2028. That is not a market softening. It’s the cap itself recalculating — the collar is indexed to the accredited capacity of PJM’s reference resource, so the ceiling moves modestly year to year. The auction hit it either way.
4.6 The collar — and the cliff behind it
What it is. Facing the 2025/2026 shock and the political consequences of it, the governors of the PJM states negotiated a price cap and floor with PJM, which FERC approved. The ceiling was set through an agreement involving a coalition of governors from all thirteen PJM states and the Federal Energy Regulatory Commission.
The floor is not incidental. For 2027/2028 the floor was $65,535/MW-year against a cap of $121,705/MW-year — roughly $180 and $333 per MW-day respectively. The bargain was symmetric: consumers get protection from the ceiling, generators get a revenue guarantee from the floor. Both sides gave something.
How long it lasts. Originally two delivery years. In April 2026, FERC accepted PJM’s proposal to extend the collar to the 2028/2029 auction and to the 2029/2030 auction, which closes December 15, 2026.
Here is the part to underline. A price cap changes a number. It does not build a power plant.
The evidence that the cap is binding rather than incidental is direct: in the 2027/2028 auction, 809.6 MW of UCAP failed to clear specifically because those offers exceeded the temporary price cap. PJM’s own report notes that a cap below the VRR curve’s own ceiling can reduce investment and therefore supply.
The Independent Market Monitor quantified the transfer. Actual RPM revenues for the 2027/2028 auction totaled $16.41 billion; under an unrestricted VRR curve, revenues would have been $26.32 billion — $9.91 billion, or 60.4%, higher.
That roughly $10 billion did not evaporate. It was not paid to generators, which means it was not available to finance new capacity in a market that is short of it.
And the market is short. For 2028/2029, PJM procured 138,318 MW UCAP with a resulting reserve margin of 14.7% — 6,831 MW, or 5.6%, below its reliability requirement. The prior year was worse in one respect: 2027/2028 was the first auction in which the entire RTO, including FRR areas, fell short of the reliability requirement — and 2026/2027 had cleared the requirement by only 139 MW.
The cliff. Assemble the pieces:
- Capacity cost is known and capped through May 31, 2030.
- Three consecutive auctions cleared at the ceiling, with unconstrained simulations running 60–70% higher.
- The market has cleared short of its own reliability requirement two years running.
- No extension has been approved beyond the 2029/2030 auction.
For a business signing a supply contract today, that’s the single most important fact in this guide. Contracts extending past mid-2030 cross a regulatory discontinuity. Not necessarily a bad one — new supply may arrive, load forecasts may moderate, the collar may be extended again. But it is a genuine unknown sitting inside any long-dated fixed price, and your supplier is pricing it whether or not they discuss it with you.
4.7 What PJM is doing about it
PJM is not passive here, and the interventions are worth tracking because they’ll shape prices after 2030.
Reliability Backstop Procurement. PJM has formally proposed a one-time procurement targeting 14.9 GW of new capacity — bilateral contracting in September 2026 followed by a central pay-as-bid auction in March 2027 — against a projected 50–60 GW shortfall over the next decade. This sits outside RPM entirely: a direct intervention to contract new supply that the capped auction isn’t attracting.
Reliability Resource Initiative. An expedited interconnection path for shovel-ready projects. It attracted more than 11,000 MW of ICAP in planned new projects and upgrades to existing generation — real developer interest, though ICAP is not UCAP and interconnection is not construction.
Broader workstreams. PJM is working to clear the interconnection queue backlog, facilitate long-term bilateral agreements between large load customers and generation providers, and maximize the performance and availability of the existing fleet.
PJM’s own diagnosis is more candid than most trade coverage. Its shortfall report describes a “transition gap” — a disequilibrium in which accelerated demand collided with rigid physical and administrative constraints on supply. The 2024 load forecast tripled historical growth rates on the back of shovel-ready data center proliferation, and subsequent forecasts confirmed PJM is chasing a target expanding faster than infrastructure can physically be built. The same report concludes that the 2027/2028 results mark the end of the era of surplus capacity in the PJM footprint.
Read that last line as a market participant, not a spectator. The surplus that kept capacity cheap for fifteen years is gone, and PJM says so in writing.
4.8 What this means for you
Through May 2030: your capacity cost is knowable. Auction results are public the day they clear. Any supplier quoting you a capacity pass-through for a delivery year that’s already cleared is quoting a known number — so ask them to show it separately rather than buried in a blended rate.
After May 2030: genuine uncertainty, skewed to the upside. Long-dated fixed offers carry a premium for this, and you should know you’re paying it.
Regardless of either: your capacity charge is your PLC — your peak load contribution — multiplied by the clearing price. You cannot change the price. You can absolutely change the PLC, and a 20% reduction is worth the same as a 20% price decrease that nobody is going to hand you.
But first, the line item that’s growing even faster than this one, and that almost nobody is watching.
Part 5 — Transmission, NITS, and Network Service
Capacity gets the headlines. Transmission gets the money.
While the capacity market was repricing in public, transmission charges across PJM have been climbing steadily, quietly, and without a single auction to blame it on. There’s no clearing price to report, no dramatic percentage to put in a press release. Just a line item that grows every year through a mechanism most customers have never heard of and cannot negotiate.
It’s also the line item with a management lever hiding inside it — one that operates on a completely different schedule than the capacity lever, and that most curtailment programs miss entirely.
5.1 Transmission versus distribution
Two different networks, two different regulators, two different sets of rules.
Transmission is the interstate highway system: high-voltage lines (69 kV and up, generally) moving bulk power across long distances. Owned by Transmission Owners, planned by PJM, regulated by FERC at the federal level.
Distribution is the local road network: the substations, poles, and wires that step voltage down and deliver power to your building. Owned by your utility, regulated by your state utility commission.
Both are non-bypassable. No supplier contract changes them. No amount of shopping avoids them. If you take power from the grid, you pay for the wires that brought it — and you pay whatever the applicable tariff says.
That’s the bad news. The good news is that “non-negotiable” is not the same as “unmanageable,” because how much of the total you’re allocated depends on your own metered behavior.
5.2 NITS: what you’re actually buying
Network Integration Transmission Service is the product that gives load access to the transmission system.
The alternative product is Point-to-Point service — a reserved path from a specific injection point to a specific delivery point, priced like a toll road. That’s what a marketer moving power across the system buys.
NITS is different, and the difference matters conceptually. NITS doesn’t buy you a path. It buys you integration into the entire network — the right to draw from the pool (Part 1’s lake) with the whole system planned and operated to serve you. You’re not renting a lane; you’re buying a share of the highway system.
Which means your charge can’t be based on a path. It has to be based on your share of the load the system was built to serve. And that share is measured in a very specific way.
5.3 The two peaks: PLC and NSPL
This is the most valuable thing in this section, and possibly in this guide.
You have two separate peak-based tags, they are set in different hours, measured against different geographies, and they drive different charges:
| PLC (Peak Load Contribution) | NSPL (Network Service Peak Load) | |
|---|---|---|
| Drives | Capacity charge | Transmission (NITS) charge |
| Measured against | The PJM RTO system peak | Your transmission zone’s peak |
| How many hours | Five coincident peaks (5CP) | One coincident peak (1CP) |
| Set by | Your average demand across those five hours | Your demand during that single hour |
| Applies to | Delivery year starting June 1 | Delivery year starting June 1 |
Read the second row again. Your capacity tag is set by your demand when all of PJM peaks. Your transmission tag is set by your demand when your zone peaks. Those are not the same event.
They frequently land close together — both are typically hot summer weekday afternoons, and a zone often peaks on one of the same days the RTO does. But “frequently” is not “always,” and the hours can differ. A curtailment program built exclusively around the five RTO peaks will catch your NSPL sometimes, by coincidence, and miss it other times.
Two practical consequences:
First, most businesses that manage peaks at all only manage one of them. The energy industry talks constantly about 5CP and capacity tags. NSPL gets a fraction of the attention despite driving a charge that, for many C&I customers, runs a meaningful share of what capacity does. If you’re already running a curtailment protocol, extending it to cover zonal peak risk is close to free.
Second, both tags carry a twelve-month lag. The demand your meter records this summer sets tags that apply to the delivery year beginning June 1 of next year and running twelve months. That lag is the whole opportunity. A handful of hours of operational discipline in July prices two line items for the following year. Miss those hours and you’ve locked in the consequence — there is no mid-year correction.
Who calculates them: your electric distribution utility, using your interval meter data, after PJM confirms the peak hours. The values are then provided to your supplier and used in settlement.
And you can check their work. Tags are calculated from your own interval data, which you have a right to obtain. Errors happen — meter multiplier problems, missing intervals, accounts assigned to the wrong profile, load that was legitimately offline during a peak but got assigned an estimated value. A tag verification is a modest exercise with an occasionally significant payoff, and it’s a standard part of any competent bill audit.
5.4 Formula rates: a cost with no market discipline
Here’s why the transmission line grows every year regardless of what happens in any market.
Transmission Owners don’t bid their service into an auction. They recover their costs through FERC-approved formula rates filed under Attachment H of the PJM tariff. The formula calculates an Annual Transmission Revenue Requirement, roughly:
Return on rate base + Operating & maintenance + Depreciation + Taxes = Annual Revenue Requirement
Rate base is net invested capital in transmission assets. The return is a FERC-authorized rate of return on equity applied to that base, plus the cost of debt.
Follow the incentive. The Transmission Owner earns a regulated return on capital invested. More investment produces a larger rate base, which produces a larger revenue requirement, which produces higher charges to load. Investment must be prudent and is subject to challenge — but within that constraint, building is how a regulated transmission business grows earnings.
This is not a scandal. It’s the design. Regulated returns are what make anyone willing to finance thirty-year infrastructure assets with no market upside. But you should understand the structure you’re paying into: unlike energy or capacity, there is no competitive pressure pushing this number down. There is a formula, an annual update, a challenge window, and a trajectory.
The rates update annually through informational filings. Interested parties can review and contest them. Essentially no end-use customers do.
5.5 Why transmission costs are climbing now
Several forces are compounding at once:
Replacement of aging assets. Much of the bulk transmission system dates to the 1950s–1970s. Those assets are reaching end of life simultaneously, and replacement is capital investment that flows straight into rate base.
RTEP reliability projects. PJM’s Regional Transmission Expansion Plan identifies violations and orders solutions. Load growth and shifting generation patterns have expanded that pipeline substantially.
Interconnection-driven upgrades. Every generator and large load connecting to the system may trigger network upgrades. Some costs are assigned to the interconnection customer; some become network costs socialized across load. Which is which is one of the live fights in 5.7.
FERC Order 1920. The 2024 long-term regional transmission planning rule requires planning across multi-decade scenarios rather than reacting to near-term violations. More planning horizon means more identified need means more construction.
Equipment cost inflation and lead times. Large power transformers, breakers, and conductor have seen severe cost escalation and multi-year delivery queues. The same project costs materially more than it did five years ago.
Cost of capital. The return component is applied to a growing rate base in a higher-rate environment. Both terms moved the wrong way for ratepayers.
None of these reverse quickly. Model transmission as a structurally rising line item, not a volatile one.
5.6 The other pass-throughs riding alongside
A few additional charges live on this part of the bill and are worth being able to identify:
PJM administrative charges (Schedule 9). PJM’s own operating cost recovery — market operations, control area administration, capacity market administration. Genuinely small, typically well under a dollar per MWh.
RTEP cost allocation (Schedule 12). The mechanism assigning regional transmission expansion project costs across zones. Cost allocation methodology here — who pays for a line that benefits multiple zones unevenly — has been litigated for years.
Reliability Must Run (RMR) charges. When a generator files to retire but PJM determines it’s needed for local reliability, the unit can be kept running under a cost-of-service RMR agreement. The costs are allocated to the area that needs it. These have grown from an obscure footnote into a real bill item in affected zones — the Baltimore-area retirements that drew significant attention and litigation are the clearest recent example of how large and how contested a single RMR arrangement can become.
Where all this appears on your bill varies. Depending on your state and utility, transmission may appear as a utility delivery charge or be included in your supplier’s rate. Verify which applies to you before comparing two supply quotes — if one supplier includes transmission and the other passes it through, the headline rates are not comparable. This is one of the most common apples-to-oranges errors in commercial energy procurement.
5.7 The fight over who pays
The unresolved question in PJM right now is straightforward to state and enormously difficult to answer: when a large new load drives billions of dollars of transmission investment, who pays for it?
Regulators and states have moved aggressively on this. Following its October 2025 ANOPR, FERC issued a December 2025 order requiring PJM to implement transparent rules for substantial loads co-located with generation, and has since weighed a January 2026 Statement of Principles concerning PJM alongside a Ratepayer Protection Pledge announced in March. A bipartisan coalition of governors has demanded that data centers bear the costs they cause, and major technology companies have signed commitments intended to shield consumers from data center-driven cost increases in PJM territory. In June 2026, FERC extended action beyond PJM, directing MISO, SPP, CAISO, ISO-NE, and NYISO on large load integration as well.
For a commercial or industrial buyer, the takeaway isn’t the procedural detail. It’s this: the cost allocation rules that determine your transmission bill are actively being rewritten, and the outcome is not settled. That’s a real source of uncertainty in any multi-year contract — and it’s exactly what a change-in-law clause is designed to shift onto you if you don’t negotiate it.
5.8 What you can actually do
Transmission feels immovable. Three things are not:
Manage your NSPL. Add zonal peak risk to your curtailment protocol. Same infrastructure as 5CP management, different hours, incremental cost near zero.
Verify your tags. Both NSPL and PLC, against your own interval data, annually.
Read your contract’s treatment of transmission. Bundled or passed through? If passed through, how is the rate determined, and what happens when the underlying formula rate updates? A pass-through with no definition is an open-ended obligation.
That covers the wholesale picture — who makes power, what they sell, how it’s priced, and how it moves. Now we turn to the company that packages all of it and sends you an invoice.
Part 6 — Retail Electric Providers: What You’re Actually Buying
Your supplier probably doesn’t own a power plant.
This surprises people, and it shouldn’t. The retail supplier sitting between you and the wholesale market is not primarily an energy company. It’s a financial intermediary that warehouses risk — it buys wholesale products, converts them into a promise you can budget around, and charges you for the conversion.
Understanding that changes how you negotiate. You are not haggling with a manufacturer over the price of a good. You are buying an insurance product, and the premium is the point.
6.1 What a supplier actually does
Consider an airline. It doesn’t refine jet fuel. It buys fuel forward, hedges the exposure, and sells you a seat at a fixed price months before the flight. If fuel spikes, the airline absorbs it. If fuel collapses, the airline keeps the difference. Your ticket price includes the hedge plus a margin for bearing that risk.
A retail electricity supplier does the same thing with power.
Here’s what it takes on when it signs you:
| Risk | What it means |
|---|---|
| Shape risk | Your load isn’t a flat block. Wholesale products mostly are. The supplier bridges the difference. |
| Volumetric / swing risk | You contracted for 5,000 MWh. You might use 4,200 or 6,100. The supplier hedged for one number. |
| Basis risk | Hedges execute at Western Hub. Your load settles at your zone. |
| Capacity risk | Your PLC changes annually. The obligation follows it. |
| Credit risk | The supplier buys wholesale on its own balance sheet and bills you in arrears. |
| Regulatory risk | Rules change mid-contract. Someone eats it. |
Every one of those is a real cost, and every one is inside your rate.
A fixed price is not a price. It’s a bundle of hedges plus a risk premium.
Which reframes the negotiation entirely. The question isn’t “why is this supplier charging more than the market?” It’s “what am I asking them to absorb, and is the premium fair for that?” A customer with erratic load, weak credit, and a demand for full price certainty is buying substantially more insurance than a stable, well-capitalized customer buying the same kilowatt-hours — and will pay for it, correctly.
Not all suppliers are the same animal. Some are affiliated with generation fleets and run wholesale trading desks. Others are pure resellers buying block products from wholesalers and marking them up. The difference shows up in three places that matter: credit strength (can they survive a bad market?), structural flexibility (can they build a custom product, or only sell what they can buy off the shelf?), and problem-solving capacity (when something breaks mid-contract, is there a desk that can restructure it?).
Terminology varies by state — REP in Texas, ESCO in New York, “electric generation supplier” in Pennsylvania, “third party supplier” in Maryland. Same function. All are licensed by state commissions and subject to consumer protection rules that differ meaningfully across the footprint.
6.2 The cost stack: what’s inside your rate
This is the section to screenshot.
When a supplier quotes you a fixed all-in price, they’ve built it from components. Here’s the build for a representative Eastern Pennsylvania C&I customer — the same profile from the intro section, now fully unpacked:
| # | Component | ~$/MWh | Negotiable? |
|---|---|---|---|
| 1 | Energy — forward curve at Western Hub, shaped to your hourly profile | $47 | No |
| 2 | Basis — hub to your zone | $3 | No |
| 3 | Shape premium — your load vs. purchasable blocks | $2 | Indirectly |
| 4 | Capacity — PLC × clearing price × 365 | $24 | Via your PLC |
| 5 | Ancillary services | $3 | No |
| 6 | Transmission (NITS) — if bundled | $12 | Via your NSPL |
| 7 | RPS / AEPS compliance — RECs, solar carve-outs | $3 | No |
| 8 | Credit and collateral | $1 | Somewhat |
| 9 | Swing / bandwidth premium | $1.50 | Yes |
| 10 | Change-in-law reserve | $0.50 | Yes |
| 11 | Broker / advisor compensation | $1.50 | Yes |
| 12 | Supplier margin | $1.50 | Yes |
| Total | ~$99 |
Illustrative. Actual values vary substantially by zone, load factor, term, credit, and delivery year.
Line losses aren’t a row because they aren’t an adder — they’re a multiplier. Your meter reads what you consumed at your building, but the supplier had to buy more than that at the wholesale level, because electricity is lost as heat between the generator and your service entrance. The gross-up runs roughly 5–8% depending on your zone and delivery voltage, and it’s applied to the wholesale components before they’re divided by your metered kilowatt-hours. It’s already embedded in rows 1 through 6.
Now look at the right-hand column, because it contains the argument of this entire guide:
Rows 9 through 12 total about $4.50/MWh — under 5% of your rate. That is the entire negotiable surface of a supplier conversation.
Rows 4 and 6 total $36/MWh — 36% of your rate. Those aren’t negotiated. They’re managed, by changing what your meter reads during specific hours.
This is why businesses that shop aggressively every three years and do nothing else hit a ceiling. They are fighting hard over five percent while ignoring a third of the bill that responds to operational discipline. Both matter. Only one of them scales.
On row 11. Broker compensation is typically embedded in your rate rather than invoiced separately — commonly somewhere between $1 and $5 per MWh, occasionally higher. There is nothing improper about this; it’s how the channel has always worked, and a supplier’s direct sales team has a cost too, it’s just not itemized. The legitimate issue is disclosure, not existence. You are entitled to ask any broker exactly what they’re being paid on your contract, and a straight answer is the minimum standard.
6.3 Default service: the option that isn’t safe
If you never sign a supply contract, you don’t stop buying electricity. You buy it from your utility at the Price to Compare — also called default service, POLR (Provider of Last Resort), or Basic Generation Service, depending on your state.
How it’s set: your utility procures supply through a series of staggered, laddered auctions under a default service plan approved by your state commission. Wholesale suppliers bid to serve slices of the utility’s default load, and the blended result becomes the PTC. It resets periodically — quarterly, semiannually, or annually depending on the utility and customer class.
Why “doing nothing” is a position, not the absence of one.
Businesses on default service often believe they’re being prudent. In fact they’ve taken a floating position with a hedging strategy designed by someone else, resetting on a schedule that has nothing to do with their fiscal year. The utility’s procurement ladder is built to serve a broad customer class with regulatory objectives in mind. It was not built around your budget cycle, your load shape, or your risk tolerance.
Sometimes the PTC is the best available price. Genuinely — it happens, particularly when a laddered portfolio is still carrying older, cheaper hedges into a rising market. But that’s an outcome, not a strategy, and it reverses when the ladder rolls.
Use the PTC as a benchmark. It’s a real, public, apples-to-apples reference point for what default supply costs in your zone. Just know what you’re comparing against: a blended average of someone else’s purchases, on someone else’s timeline.
One operational note: most states offer utility consolidated billing (supplier charges appear on your utility invoice) and some offer dual billing (two separate bills). Consolidated is simpler for AP. Dual sometimes gives better line-item visibility. Neither changes your cost — but if you’re managing a multi-site portfolio, the choice affects reconciliation workload significantly.
6.4 Evaluating a supplier — beyond the number
Most buyers compare suppliers on one variable. Here are four more that matter.
Credit strength. Suppliers fail. When one does, its customers are typically returned to default service — often abruptly, sometimes mid-summer, at whatever rate is then in effect. The wave of retail energy failures in the UK during 2021–22 and the aftermath of ERCOT’s February 2021 event are the cautionary examples, and both produced customers who discovered that a great price from a thin balance sheet isn’t a great price. Ask about the parent entity, any guarantee behind your contract, and credit ratings.
Wholesale capability. Can they build a block-plus-index product, layer purchases over time, or restructure mid-term if your load changes? A supplier with a trading desk can. A reseller quoting off a rate sheet often can’t, regardless of what the salesperson says.
Operational competence. Unglamorous and expensive when absent. Billing accuracy. How fast they add or drop accounts when you open or close a facility. Whether disputes get resolved or aged. Whether their portal produces usable interval data. For a multi-site business, a supplier who bills wrong is more costly than one who’s a quarter-cent higher.
Willingness to negotiate terms. Will they redline the contract, or is it take-it-or-leave-it? A supplier who won’t discuss bandwidth tolerances, change-in-law thresholds, or assignment rights is telling you how the next three years will go.
And one asymmetry to keep in mind. Suppliers optimize against their whole portfolio — your load is one position among thousands, and they earn on aggregate performance, not just your stated margin. That isn’t sinister. It does mean their interests and yours align only partially, and the gap is precisely what representation is for.
Which brings us to the invoice itself — and to finding all of this on the piece of paper actually sitting on your desk.
Part 7 — Reading Your Bill: From Wholesale Market to Line Item
Everything in Parts 1 through 6 is now sitting on an invoice on your desk, wearing different names.
This section is a translation exercise. Pull a recent bill — ideally a summer month, since that’s when the interesting charges show up — and work through it alongside this.
7.1 The two halves
Every commercial electric bill divides into two fundamentally different categories, whether or not the layout makes it obvious:
| Supply | Delivery | |
|---|---|---|
| What it covers | Generation, capacity, ancillary, sometimes transmission | Transmission and distribution wires, metering, riders |
| Who sets it | Your supplier (or the utility’s default rate) | State-approved tariff |
| Competitive? | Yes | No |
| Changes if you shop? | Yes | Never |
The single most common bill-reading error is comparing two supply quotes without confirming they cover the same components. If Supplier A bundles transmission and Supplier B passes it through, A’s number will look worse by roughly $10–15/MWh and be the better deal. This happens constantly. It is the most reliable way to lose money in a competitive market.
Before comparing anything, answer one question about each quote: what’s in it?
7.2 The line items, decoded
Energy charges (kWh). Consumption, priced per kilowatt-hour. May be split into on-peak and off-peak buckets depending on your tariff. This is the intuitive part of the bill and, as Part 6 showed, roughly half of your supply cost.
Demand charges (kW). Here’s where it gets less intuitive. Your utility meters your highest 15-minute average demand during the billing month and charges for it separately — typically several dollars per kilowatt, per month.
The logic is sound: the local wires serving your building must be sized for your maximum draw, not your average. A facility pulling 800 kW for one interval and 200 kW the rest of the month still requires 800 kW of infrastructure.
And then there’s the ratchet. Many commercial tariffs include a demand ratchet: your billed demand is the greater of this month’s peak or some percentage — often 60% to 80% — of your highest peak over the trailing eleven or twelve months.
Read that again, because it’s expensive. One bad fifteen-minute interval in July can set a floor under your demand charges through the following June. Start three large motors simultaneously after a holiday shutdown, or run a test that nobody thought about, and you’ve purchased a year of elevated billing in a quarter of an hour.
Ratchet provisions vary by utility and rate class. Find yours. If you have one, interval-level startup discipline stops being housekeeping and becomes a budget item.
Capacity charge. Your PLC × the clearing price × days in the period. May appear as a distinct line, may be folded into your supply rate, may be labeled “RPM charge” or “capacity obligation.” If you can’t find it, ask your supplier to break it out — and if they won’t, that tells you something.
Transmission / NITS charge. Your NSPL-driven charge, per Part 5. Same caveat: it may sit on the delivery side or inside your supply rate, depending on your state and contract.
Distribution charges. The local wires. Usually a mix of a fixed customer charge, a demand component, and a volumetric component. Non-negotiable, but see 7.3 on rate class.
Riders and surcharges. These accumulate quietly and vary by state. Common categories:
- Universal service and low-income assistance programs
- Energy efficiency and conservation program cost recovery
- Storm damage and reliability cost recovery
- Nuclear or renewable support mechanisms, where applicable
- Stranded cost recovery, in some jurisdictions
- Smart meter deployment recovery
Each is small. Together they’re not, and they’re worth reviewing annually — riders get added, expire, and get misapplied.
Taxes. Sales tax where applicable, plus state-specific levies. In Pennsylvania, the Gross Receipts Tax applies to electric supply and runs materially higher than most buyers expect. It’s calculated on the supply portion, which means it also amplifies the cost of a bad supply decision.
The exemption worth checking today: most states in the footprint exempt electricity used directly in manufacturing, processing, mining, or agriculture from sales tax. Businesses fail to claim this constantly — sometimes for years. Qualifying often requires a predominant-use study and a filed exemption certificate, and refunds are typically available retroactively within a statutory window. This is a phone call that occasionally returns five figures.
7.3 Your rate class is a decision, not a fact
Your tariff schedule determines the entire structure of your delivery charges: the ratio of demand to energy charges, whether time-of-use windows apply, whether a ratchet exists, and what discount you receive for taking service at primary rather than secondary voltage.
Utilities assign you a rate class based on your characteristics at the time you were connected. Your business has probably changed since then. You added a shift, installed efficient equipment, closed a line, or moved from one usage tier to another — and nobody at the utility reviewed whether your assignment still fits.
Worth verifying:
- Are you eligible for a rate class better suited to your current load shape?
- Do you take service at primary voltage and own your transformer? Many tariffs offer a discount for that, and it’s sometimes unclaimed.
- If your tariff has time-of-use windows, does your operating schedule align with them, and could it?
- Are all meters at a multi-meter site classified correctly, and would aggregation help?
Rate class optimization requires no capital and no contract change. It’s the closest thing to free money on this list, and it’s routinely left alone because it’s nobody’s job.
7.4 Two customers, same kilowatt-hours, very different bills
Here’s the section that makes the case better than any argument could.
Two Eastern Pennsylvania facilities. Both consume exactly 5,000 MWh per year. Identical annual consumption, identical zone, identical supply contract terms.
| Facility A | Facility B | |
|---|---|---|
| Annual consumption | 5,000 MWh | 5,000 MWh |
| Peak demand | 1,000 kW | 671 kW |
| Load factor | 57% | 85% |
| Profile | Single shift, heavy afternoon cooling load | Continuous operation, steady draw |
Load factor is the ratio of average demand to peak demand — how flat your consumption is. Calculate yours:
Load Factor = Annual kWh ÷ (Peak kW × 8,760)
Now the cost consequences:
| Component | Facility A | Facility B | Difference |
|---|---|---|---|
| Capacity (PLC × $325/MW-day × 365) | $118,600 | $83,000 | $35,600 |
| Transmission (NSPL-driven) | $60,000 | $42,000 | $18,000 |
| Distribution demand charges | $96,000 | $64,400 | $31,600 |
| Shape premium in supply rate | $10,000 | $3,750 | $6,250 |
| Annual difference on identical consumption | ~$91,000 |
Illustrative figures using representative Eastern Pennsylvania rates. Actual results vary by utility, tariff, and PLC coincidence.
Same electricity. Same market. Same contract. Roughly $91,000 a year in difference, driven entirely by when the power was used rather than how much.
One important nuance. Load factor and PLC are related but not identical. Your capacity tag is set by demand during the five RTO coincident peak hours specifically — not by your own annual maximum. A facility that peaks hard at 3:00 a.m. has poor load factor and an excellent capacity tag. A facility that peaks modestly but does so at 5:00 p.m. on the hottest weekday in July has decent load factor and a terrible one.
That distinction is precisely why capacity management is a targeted discipline rather than a general efficiency exercise. You are not trying to use less electricity. You are trying to use less during a small number of identifiable hours.
7.5 What to do with your bill this week
Three things, none requiring outside help:
Decompose it. Assign every line to a category: energy, capacity, transmission, distribution, riders, taxes. Calculate what percentage each represents. Most businesses have never done this and are surprised by the result.
Calculate your load factor. One division problem. It tells you immediately whether your opportunity is primarily in procurement (high load factor — your costs are mostly commodity) or primarily in operations (low load factor — your costs are mostly peak-driven).
Find your PLC and NSPL. They’re on the bill, in your supplier’s portal, or available from your utility on request. If you don’t know these two numbers, you cannot manage roughly a third of your electricity spend.
You now have the full picture: how power is made and priced, how those costs reach your invoice, and where your leverage sits.
Our next guide will be about using it — starting with the contract structures available to you, and how to pick the one that actually fits.
Stay tuned…